March 31st, 2026
Improved
Create & Export Charts in the Chat
We're thrilled to introduce an array of powerful updates designed to elevate your data visualization experience.
New Chart Features
Explore how visualizing data just got better:
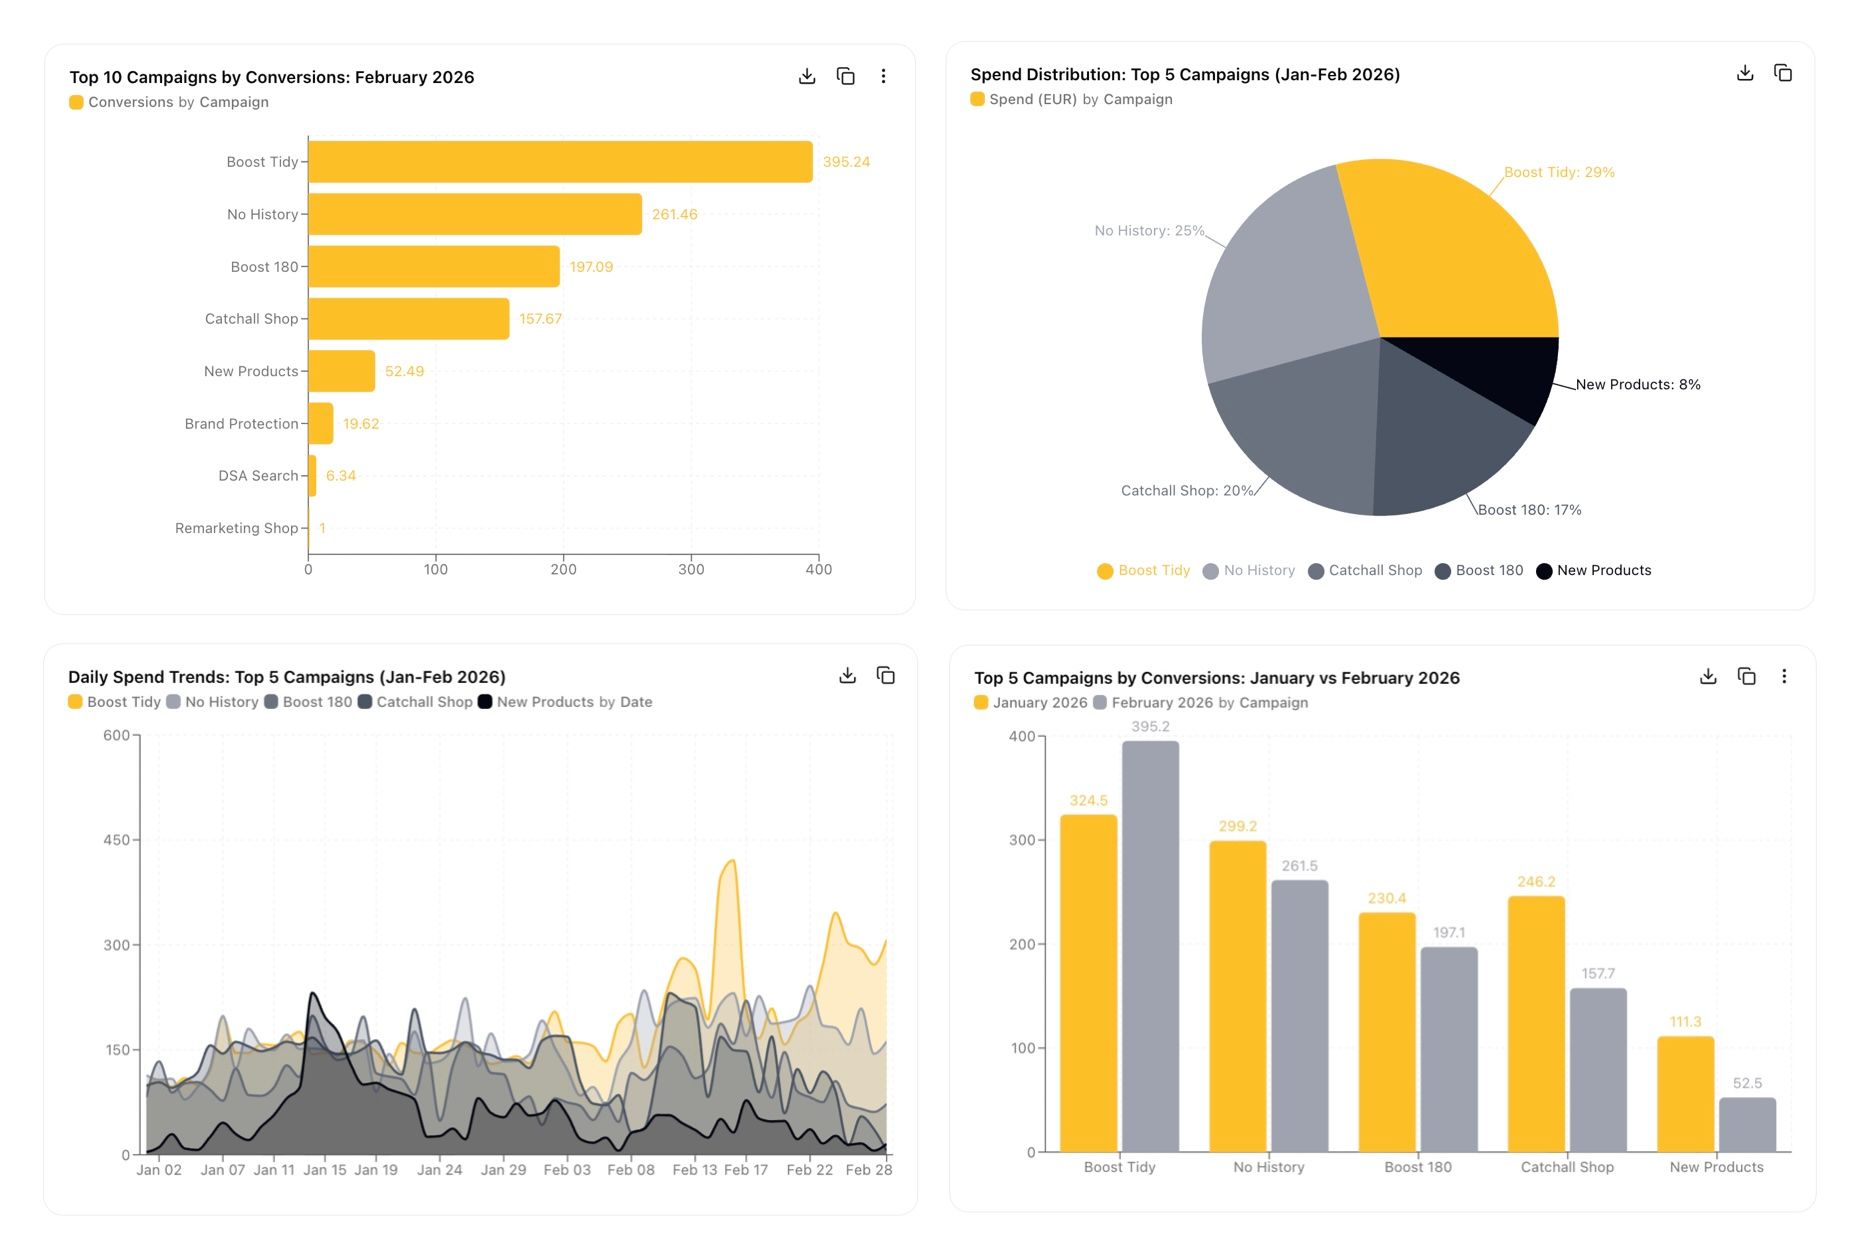
Variety of Charts: We now support the generation of Area Charts, Bar Charts, Horizontal Bar Charts, Pie Charts, and Line Charts, providing a wide range of options to represent data effectively.
Export and Share: Users can easily download their charts as PNG files or copy them to other documents seamlessly.
How to Create Charts
Simply specify the type of chart you'd like in your prompt, and our system will generate it for you. Additionally, our platform may autonomously include charts where relevant, enhancing user interactions naturally.
We genuinely hope these features enrich your usage of our platform and enable you to work with data more intuitively and efficiently.